
We've reached the last post in the series, and the pattern is probably familiar by now. In last-mile logistics, the sector also has its favorite inflated figure: you'll see promises of "reduce your operating costs by up to 50%" plastered across route optimization software product pages.
We'll say it plainly, as we have in the previous five posts: nobody is going to cut your last-mile costs by 50%. That number exists in a handful of extreme, isolated cases, and using it as a general promise is dishonest.
But here's the good news that closes the whole series: what has actually been measured is smaller than that promise and, in a thin-margin business like distribution, it is still huge. And the evidence runs from Tesco to a system that connects an independent professional association with the largest logistics operation in the world.
The last mile: where the money goes
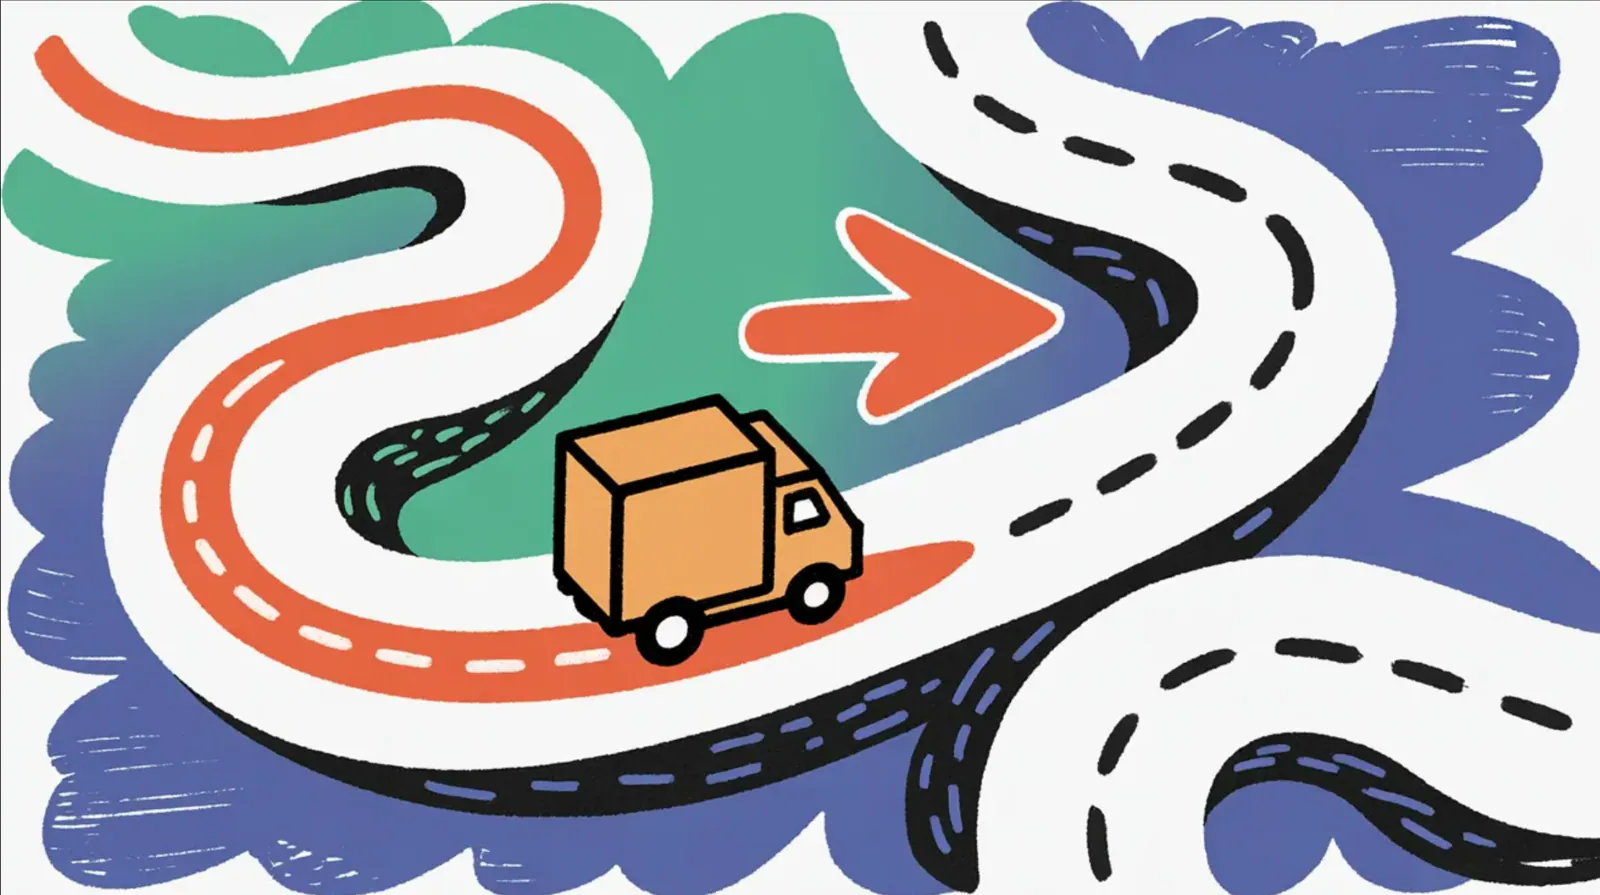
Before the numbers, some context on why this matters so much. The last mile (the final leg of delivery, from the distribution center to the customer's door) is notoriously the most expensive and inefficient stretch of the entire logistics chain. It's where a truck stops twenty times instead of once, where traffic calls the shots, where one badly entered address ruins an entire route, and where a customer who wasn't home forces you to come back tomorrow.
Every percentage point of efficiency you recover there, in a distribution business, goes straight to the bottom line. That's why an improvement of "only" 15% in a last-mile operation can be more valuable than 50% in a lower-impact area. The size of the number matters less than where you apply it.
Fuel: what has been measured and what is promised
The most concrete and easiest metric to audit is fuel consumption. And here it pays to separate what has been measured with a named customer from what vendors say about their own customer base.
At the conservative end, there's the case of Tesco, the British retail giant, implemented by the optimization firm Satalia: an 8% reduction in fuel consumption per order, plus a 5% improvement in fuel efficiency (Satalia, Tesco case). At the high end, Greenplan, a startup funded by DHL, says its customers can save up to 20% in costs compared with standard routing solutions (DHL, 2020). And vendors such as CIGO Tracker report fuel reductions of 15% to 25% across their customer base (CIGO Tracker).
The case we like to cite most, however, doesn't come from a software vendor but from an independent source. The ORION system at UPS, the most studied route optimization algorithm in logistics history, produces, according to INFORMS, the professional association for operations research, savings of 10 million gallons of fuel per year, a reduction of 100,000 metric tons of CO₂, and estimated savings of between 300 and 400 million dollars annually at full deployment (INFORMS, O.R. Analytics Success Stories: UPS).
The fact that an independent professional association, not UPS and not a vendor, certifies those numbers is what makes them solid. But there is no percentage that holds for every operation: Tesco's 8% is a measured case with a name, and the 15-25% is what vendors say about their own customers. Not 50%. And even a single-digit saving, for a fleet that covers thousands of kilometers per month, is a lot of money.
Delivery time: 20% faster, backed by a paper
The second big benefit is time. Here we have something that is rare in logistics: a published academic study, not a marketing case.
Research published in the European Journal of Logistics, Purchasing and Supply Chain Management documented, in a case using data from U.S. e-commerce companies, that dynamic route optimization (which recalculates on the fly based on traffic and real conditions, instead of planning only once in the morning) reduced delivery time by 20% (Oloko, EJLPSCM, 2024).
The distinction between static and dynamic routing is key, and most vendors blur it. Planning the route once at dawn and hoping the day goes according to plan is static routing. Recalculating in real time when a customer cancels, when there's a road closure, when a delivery took longer than expected, is dynamic routing. The 20% improvement belongs to the second, and that's where AI really contributes.
WISMO: the calls that eat your day
There is a last-mile cost that doesn't show up in the logistics spreadsheet but that anyone who has run a distribution operation knows by heart: the "where is my order?" calls. In the industry they go by their acronym, WISMO (Where Is My Order), and they are a silent drain on your customer service team's time.
The solution is simple in concept: if customers can see in real time where their order is, they stop calling to ask. Reported WISMO reduction figures with proactive tracking vary by source, from 30-40% in food distribution (Nuvizz, 2026) to isolated cases of merchants that cut those inquiries by 39.2% and 50% (Sendcloud, 2025).
Because that range is wide and most of it comes from vendors, we don't boil it down to a number of our own. What every source does show is that when customers can see where their order is, they call less. And even a small drop, for a support team that today spends hours every day answering "your order ships tomorrow," means getting full-time people's time back.
On-time deliveries: the number customers feel
Finally, the metric the end customer perceives directly: meeting the delivery within the promised window, known as On-Time Delivery or OTD. Almost all the published numbers here come from vendors about their own customers: Locus, for example, describes an online supermarket that reached 99.5% on-time deliveries (Locus). It's one case, not an industry average, and that's why we don't use it as a target.
What does apply to any operation is to measure OTD from the first day and track it: it's the kind of number that sustains the reputation of a distribution business. It's also the metric that translates best into retention: customers who receive on time come back.
A note on Latin America
It's worth closing with a regional note, because last mile in LATAM has its own rules. The region is already a mature market for this technology: Beetrack, the Chilean-born platform acquired by DispatchTrack, came to operate with more than 850 customers in 20 countries, including names like Walmart, Coca-Cola and Cencosud (DispatchTrack). In an interview, DispatchTrack's founder talked about more conservative savings, between 5% and 10%, from the smart combination of routes and stops alone (Mexico Business News, 2022).
We mention that 5-10% on purpose: it's what a vendor says about its own customers, not a benchmark, but it's very far from the 50% of the promises and in the same zone as the measured cases, like Tesco's 8%. When what a vendor says and what a named, measured case shows point to the same zone, that's the honest zone.
What you will read on the Trazzo site
After all this research, these are the figures we chose for Trazzo, our last-mile optimization product:
"More efficient routes, with fewer kilometers": no figure of our own, because the published savings are cases and vendor data, and yours is measured in your own operation.
"8% less fuel per order, in the Tesco case": Satalia, the firm that implemented it. A measured case, not an average.
"20% less delivery time with dynamic routing": Oloko, EJLPSCM, 2024, a peer-reviewed academic paper.
"Fewer 'where is my order?' calls": no figure of our own, because the published data comes from vendors and varies widely.
"On-time deliveries, measured from the start": no figure of our own, because the published percentages are cases from vendors' customers.
What you won't read is the "50% cost reduction" that shows up in some isolated case. Because that number, like WhatsApp's 98%, the chatbots' 80% and the bare 99% of invoice readers, is the kind of promise that falls apart with a single question.
And with that we close the series. Five products, five categories, one decision: in a market that shouts inflated figures, we chose the numbers that hold up to the question. Not because we're more cautious than everyone else, but because we believe you, on the other side, deserve to know what you're going to get before you sign. The truth, properly measured, is already good enough. There's no need to invent anything.
The complete series: The real numbers of enterprise AI
The AI industry lies to you with numbers: we researched which ones are real
Sellium: Your chatbot doesn't resolve 80% of inquiries, we lie to you less
Revio: WhatsApp's "98% open rate" is made up, here's the real number
Metrix: AI isn't going to answer everything for your team, it's going to answer well what matters
Arconte: Reading invoices with AI, where 99% is true and where it's marketing
Trazzo: Last mile with AI, how much fuel, time and calls you really save (you are here)
Every figure in this series is backed by its source, with date and methodology when available. If you find a data point you think we should review, write to us: we take this seriously.